Institutional Grade
Shipping & Offshore
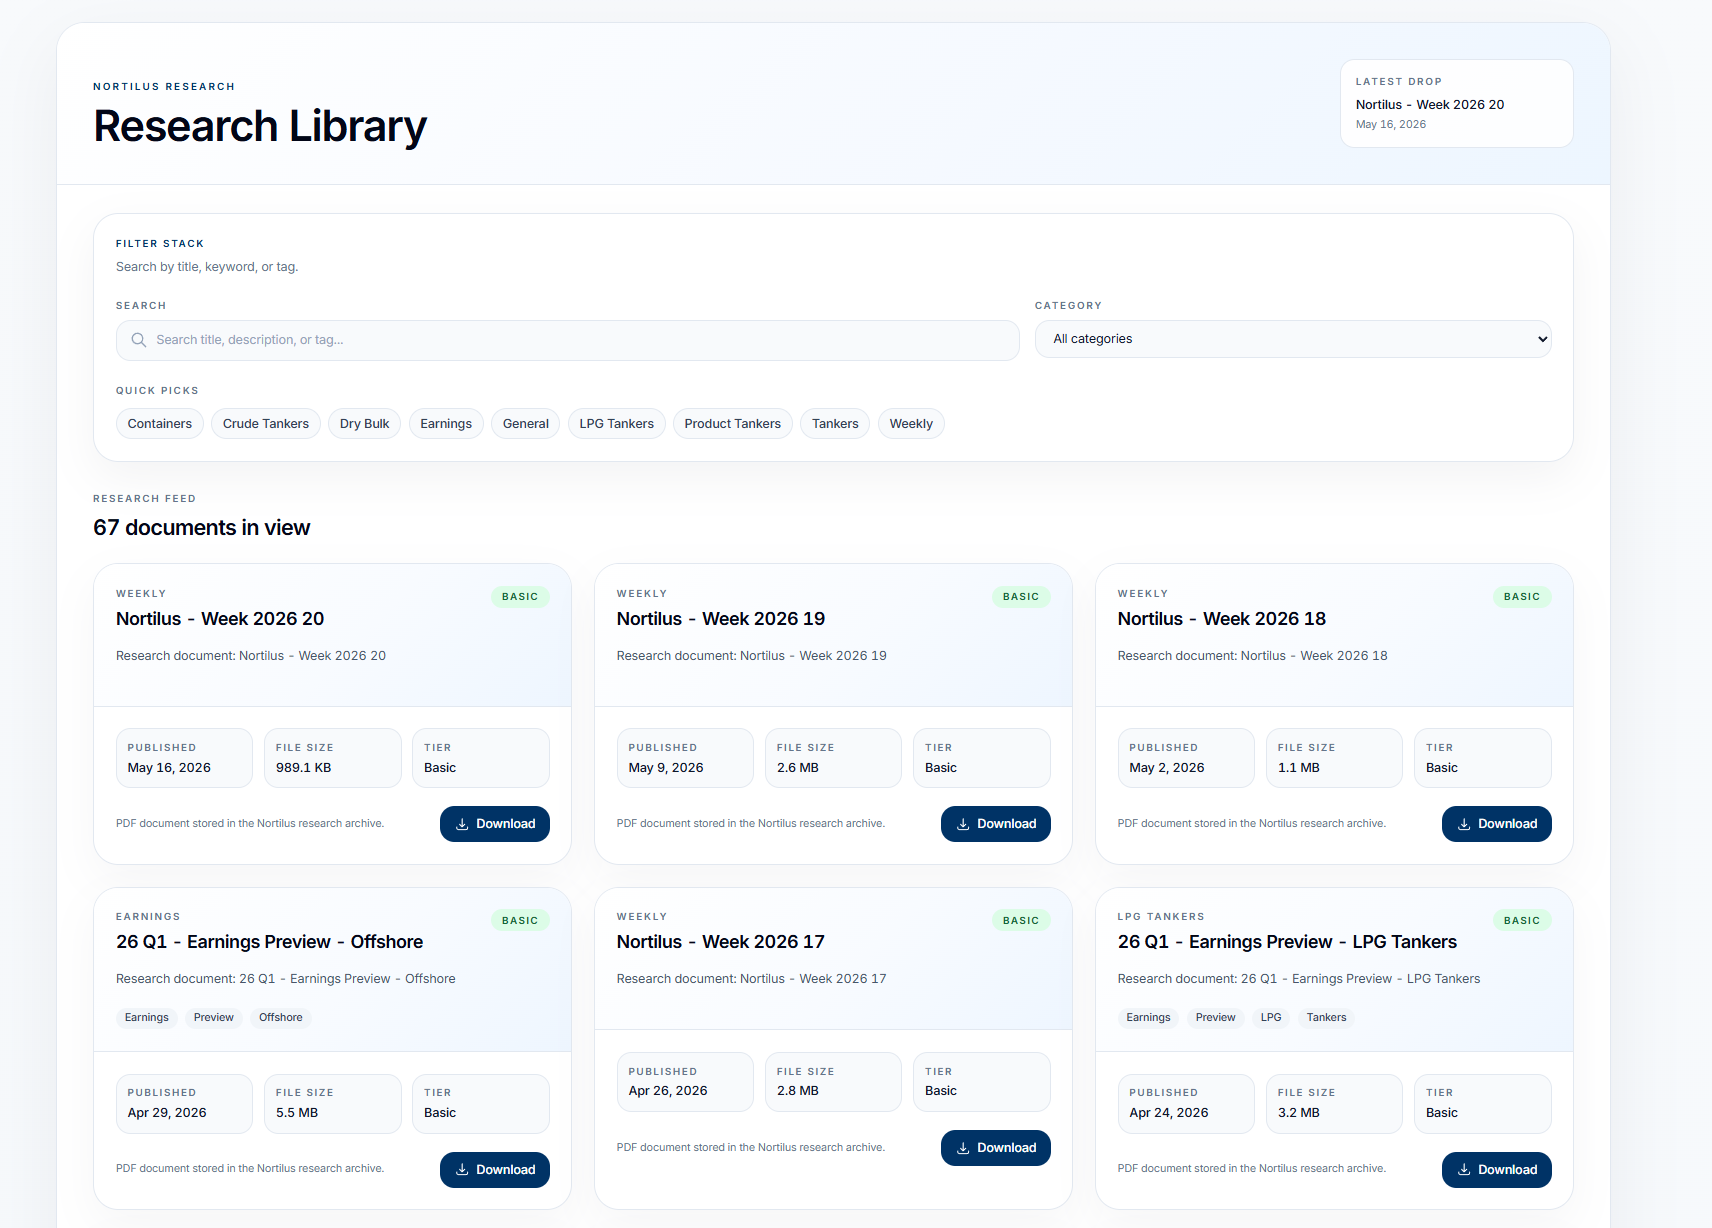
Research
Built for investors in shipping and offshore. We give you models and data to support your investment decisions.
Expectation Gap Monitor
Nortilus vs Consensus
| Ticker | Consensus | Nortilus | Actual |
|---|---|---|---|
TEN Q1 2026 | $2.02 | $73.30 | $46.70 40% closer |
DAC Q1 2026 | $4.20 | $5.84 | $6.72 65% closer |
INSW Q1 2026 | $2.14 | $3.57 | $3.90 81% closer |
ESEA Q1 2026 | $4.29 | $4.62 | $4.70 80% closer |
STNG Q1 2026 | $2.45 | $3.27 | $3.02 56% closer |
Recent earnings where Nortilus beat the street
How we build the most accurate earnings models in shipping
Sell-side models are plagued by inaccuracy, leaning on consensus data from Bloomberg and FactSet that is often wrong or heavily lags changes in the market.
Instead of working top down, we work bottom up, modelling cashflow vessel by vessel and rig by rig, adjusting for regional dynamics and vessel-level opex. The result is earnings and EPS estimates that are far more grounded and accurate.
64% of our EPS estimates beat consensus
across 373 earnings events · r = 0.974 vs actuals
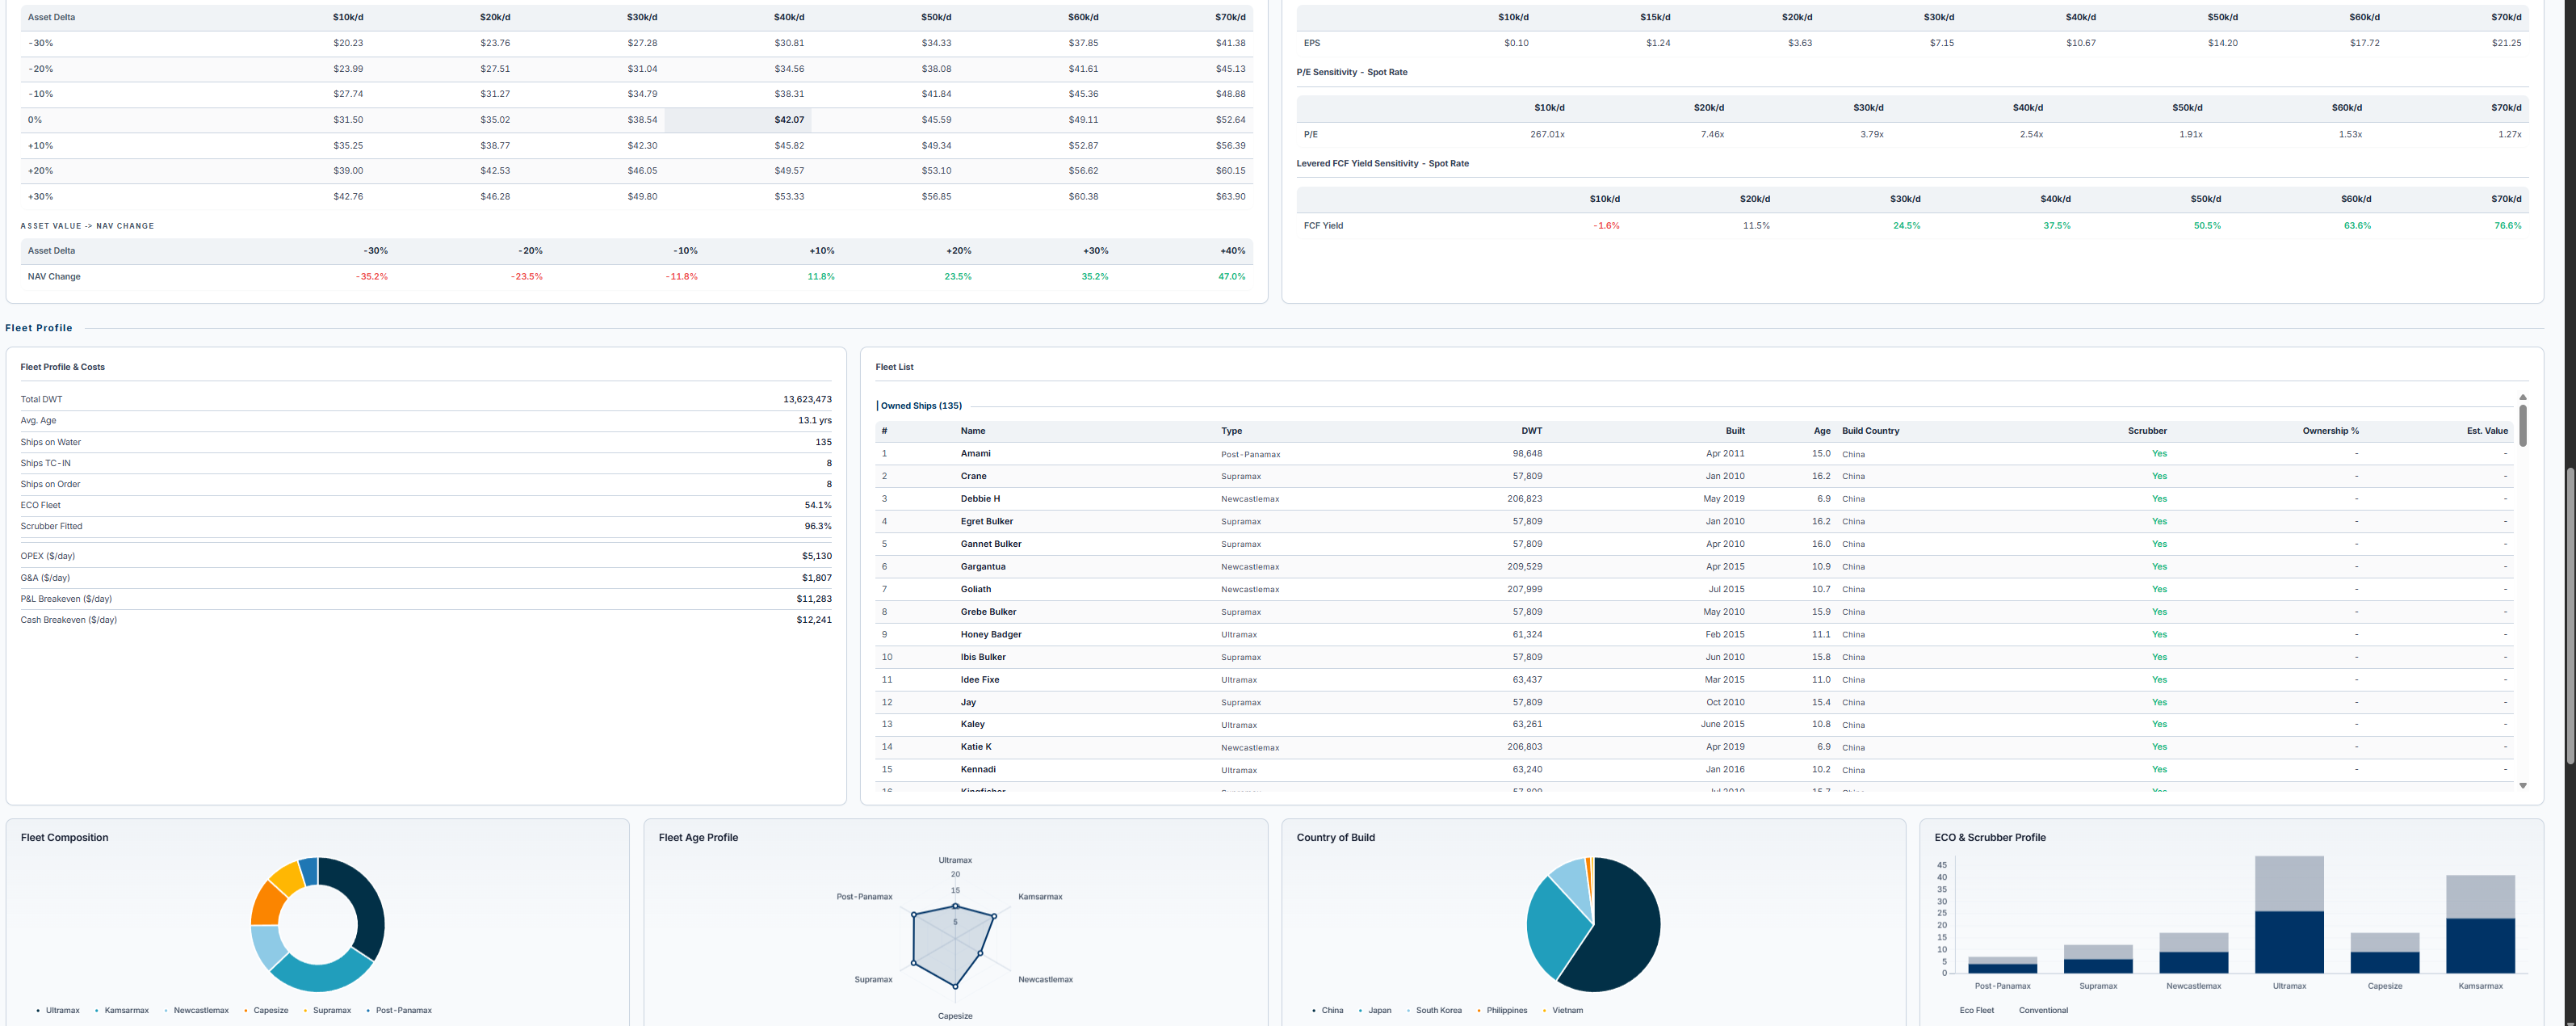
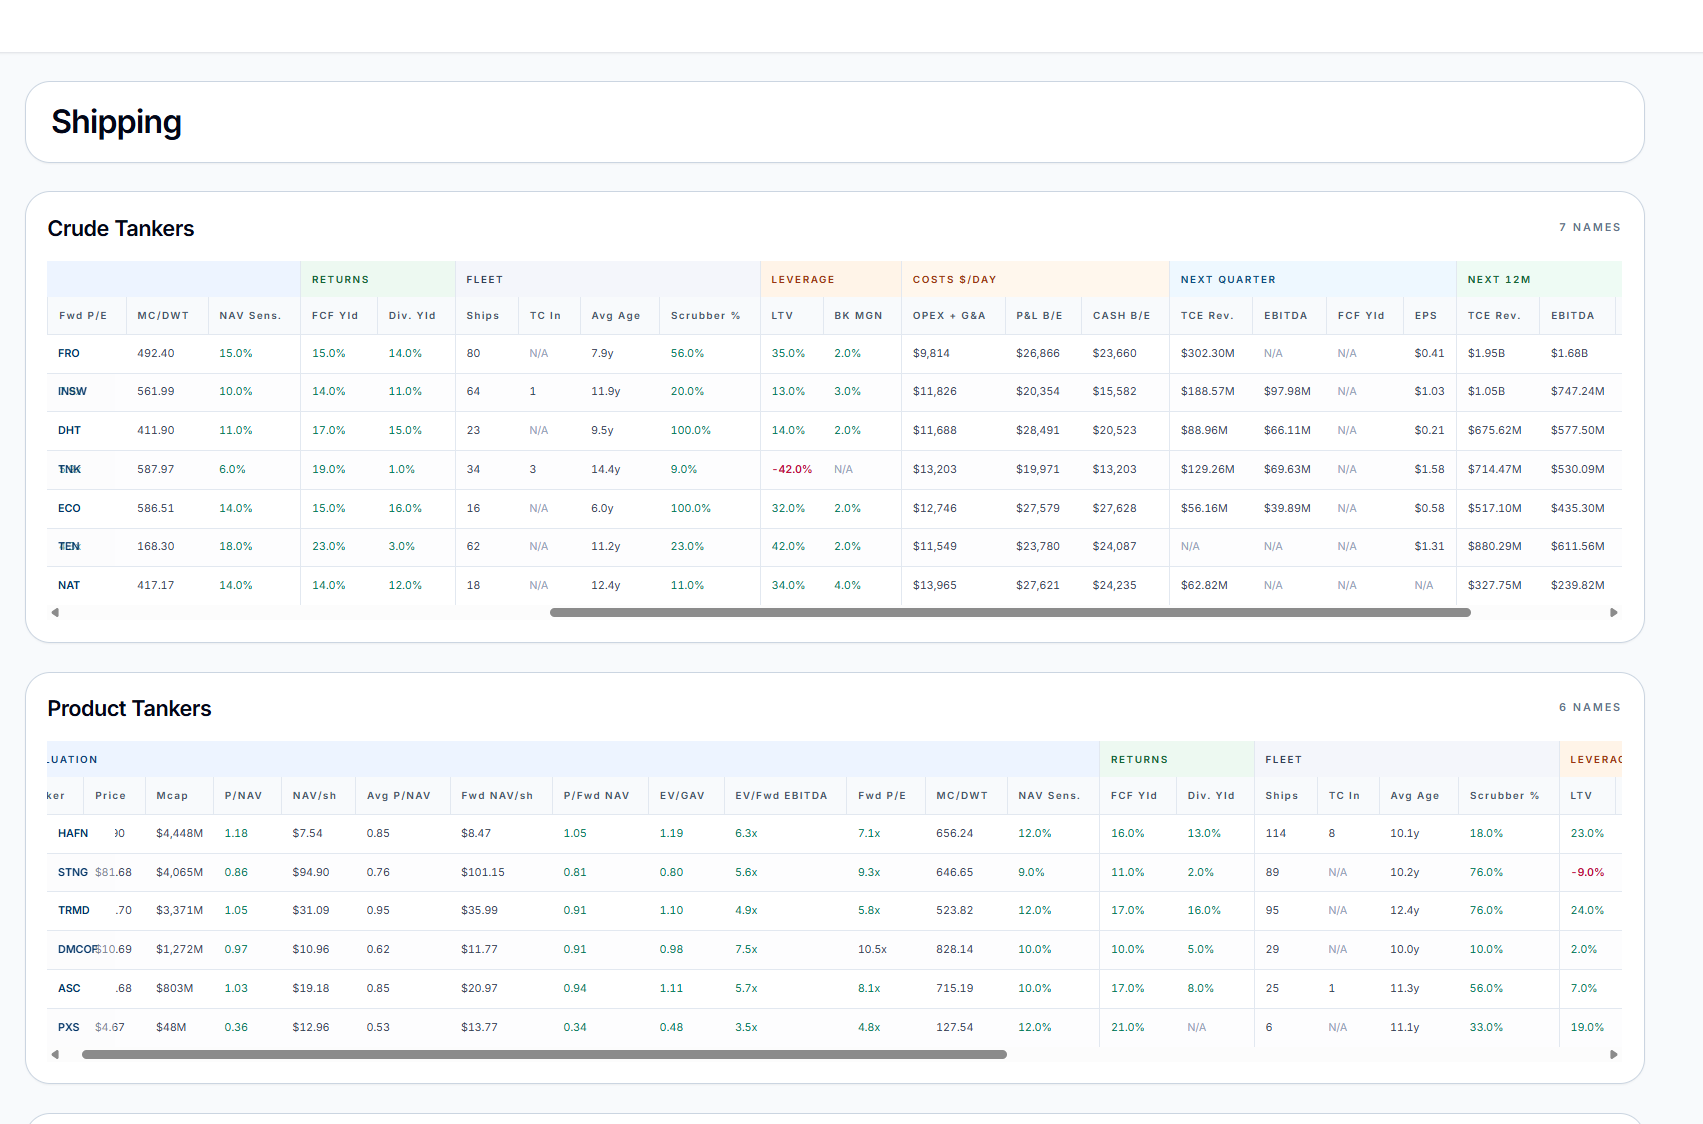
Fleet & Asset Values
Vessel count, capacity, and current market valuations by company, updated quarterly.
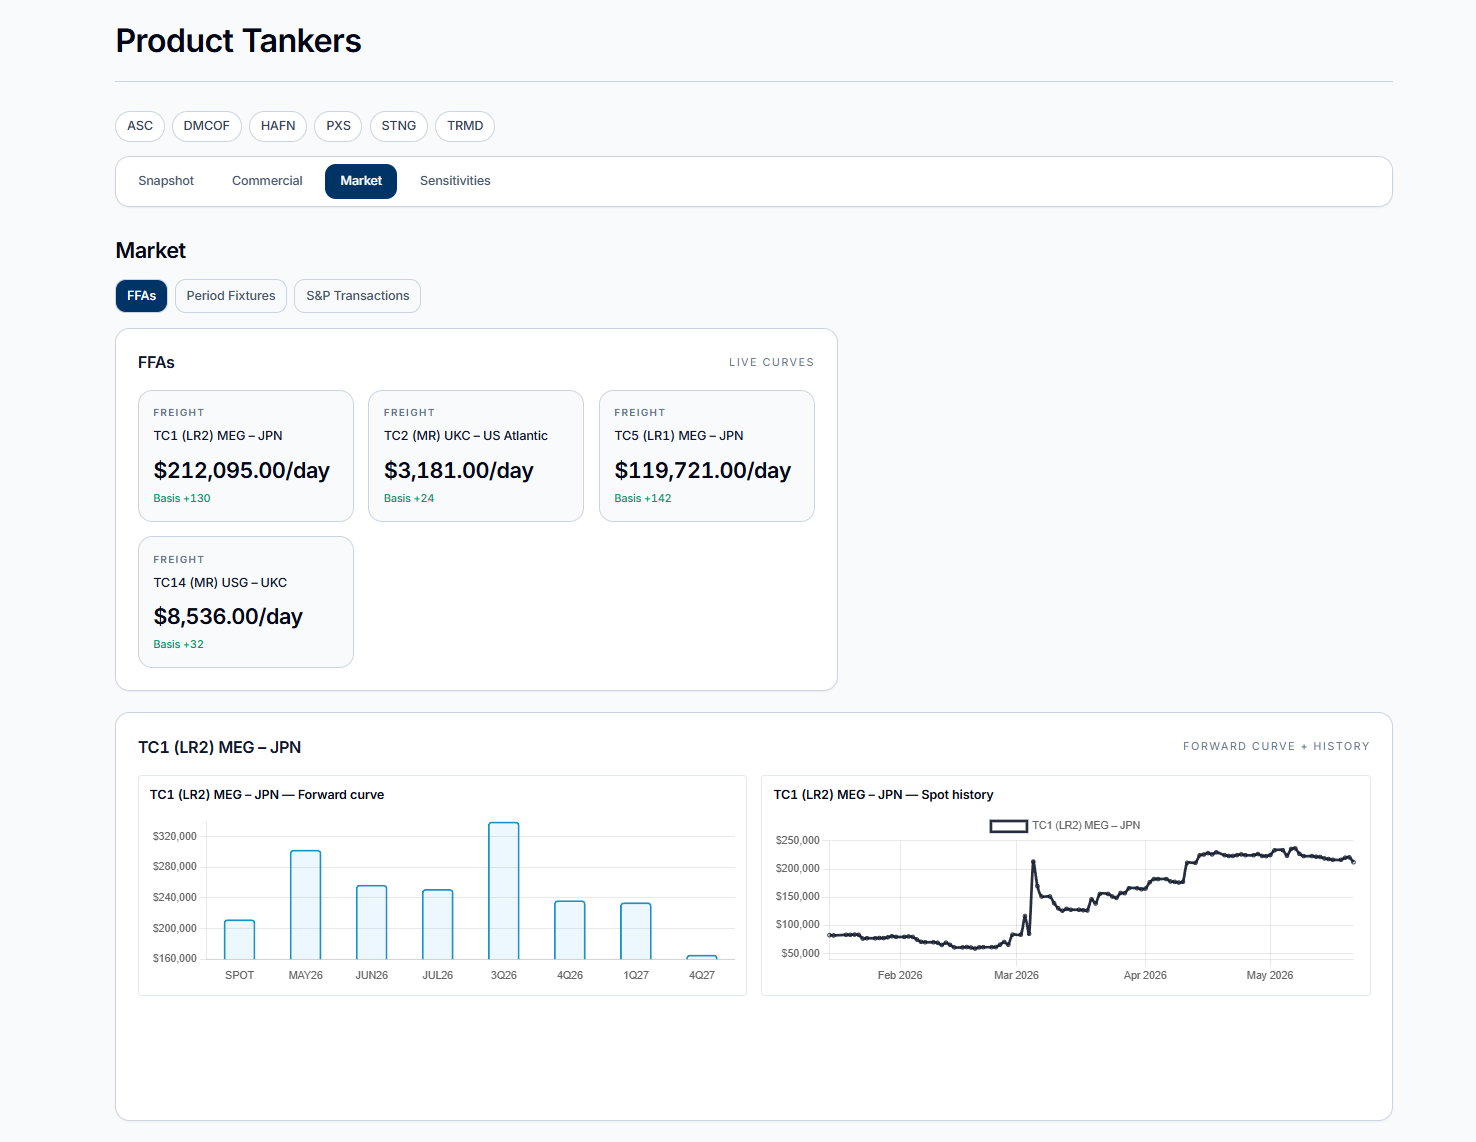
Charter Contracts & TC Rates
Active time-charter coverage, contract durations, and TC rate inputs by vessel.
Rate Exposure
Spot vs. contract mix, routing, and freight rate sensitivity across the fleet.
Cost Structures
Opex, G&A, and interest expense modelled from filings and management guidance.
Trading the Gap
Where our estimates diverge materially from consensus, we have an edge worth trading. The model systematically converts that divergence into long and short positions around reporting dates, governed by fixed parameters.
Total Return
+607%
+79.8% CAGR
Win Rate
65.7%
+2.0% avg/trade
Sharpe
2.23
Sortino 1.09
Trades
216
since Feb 2023
Historical Return. Since Feb 2023
Past performance is not indicative of future results.
Platform Preview
Models, rates, assets, and research in one workflow.
Model Portfolio
A concentrated portfolio of Nortilus top picks across shipping and offshore. Live since January 2026.
Total Return
+17.3%
since Jan 2026
Sharpe
1.25
Sortino 1.34
Active Positions
10
equal weight
Historical Return. Since January 2026
Past performance is not indicative of future results.
Built for shipping and offshore.
Proven in the market.
Better models, more data, better calls.